IRGraph: Leveraging NLP, LLMs, and Knowledge Graphs for Investor Relations
CMU MSAII Capstone Project, sponsored by sponsored by Bank of New York (BNY)

Visualization of insights on an analyst's questions across multiple calls.

End-to-End Process for IRGraph
This project was “BKGraph” during the semester project but extended to IRGraph post-capstone.
The Problem—
Earnings calls are crucial moments for financial markets, providing insights into company performance and shaping investor sentiment. However, the unstructured nature of earnings call data—spanning transcripts, audio, and stock price movements—makes it difficult for Investor Relations (IR) teams to extract actionable insights efficiently. Traditional manual processes are labor-intensive, taking weeks to analyze and leaving gaps in real-time understanding.
Our Solution: IRGraph (formerly BKGraph)—
To address these challenges, we developed BKGraph, an AI-powered framework that integrates Natural Language Processing (NLP), Large Language Models (LLMs), and Knowledge Graphs to revolutionize how IR teams process and analyze earnings calls. The project was initially named BKGraph, reflecting the BK stock ticker for BNY Mellon, but was later rebranded as IRGraph to align with broader open-source considerations and accommodate applications across the Investor Relations community.
Key features include:
Data Enrichment: Generate metadata to annotate transcripts.
Speaker-Stock Correlation: Link transcript text to stock price changes.
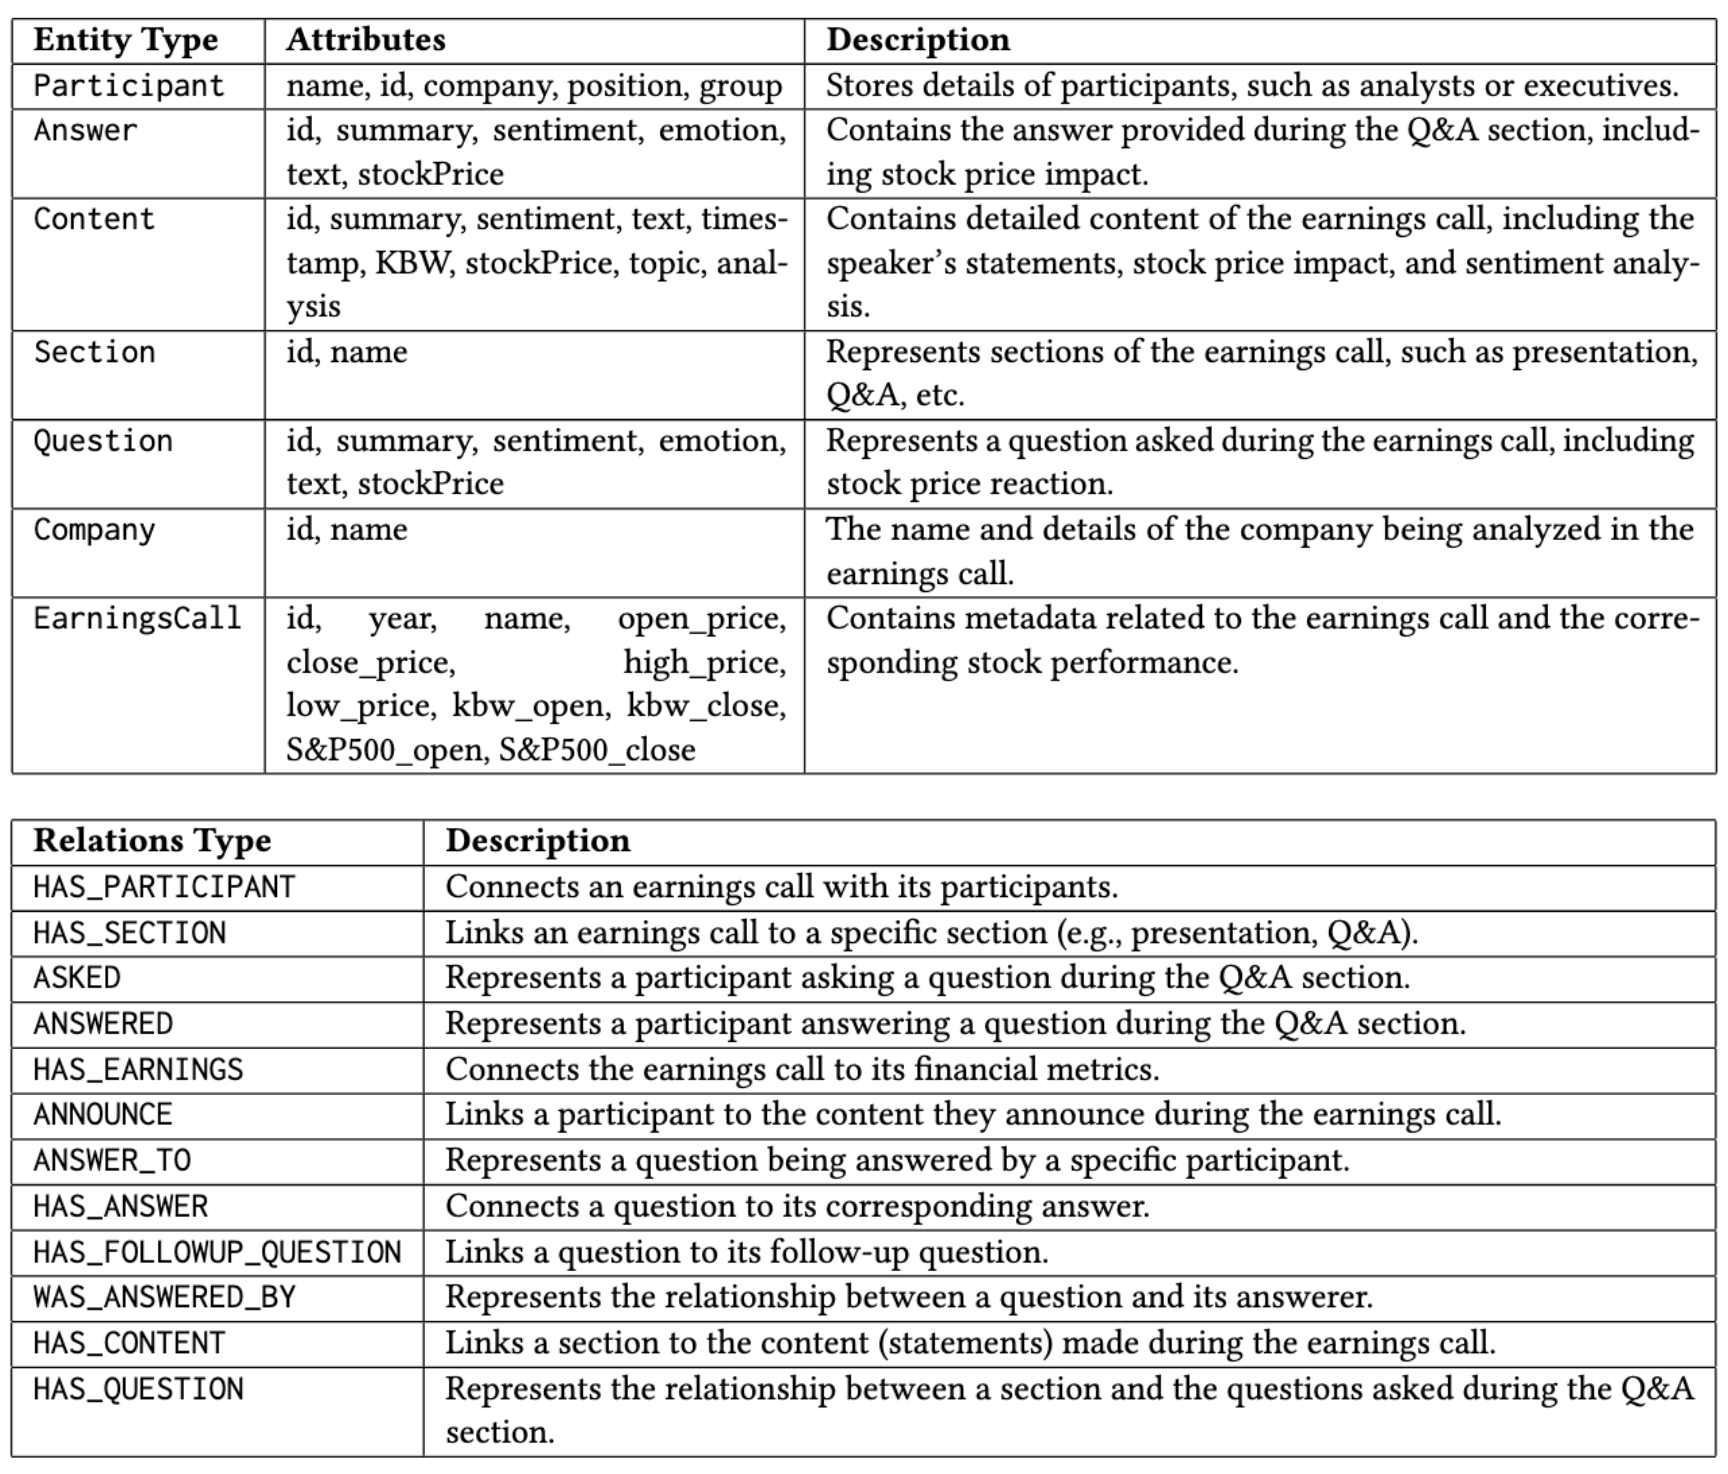
Knowledge Graph Schema: Organized data in Neo4j captures companies, participants, and relationships.
Text-to-Cypher Querying: LLMs translate questions into Cypher queries for efficient data retrieval, with a human-in-the-loop process.
Visualization Dashboard: NeoDash dashboards reveal insights with interactive charts.
Why It Matters—
This solution transforms the IR workflow:
Efficiency: Reduces preparation time from weeks to minutes.
Depth of Insights: Reveals nuanced trends in sentiment and topics over time.
Real-Time Agility: Enables potential to gather dynamic responses during live earnings calls.
Competitive Edge: Facilitates benchmarking against industry peers to enhance market positioning.
Project Structure: Upstream and Downstream Tasks—
The IRGraph project was organized into two primary task categories—upstream and downstream—to streamline development and maintain a clear workflow. Each category addressed distinct aspects of data processing and analysis, ensuring an end-to-end, efficient, and effective solution.
Upstream Tasks: Data Acquisition and Enrichment
The upstream tasks focused on acquiring, processing, and enriching raw data to prepare it for analysis. This stage ensured that unstructured earnings call data was transformed into a structured, usable format for constructing the knowledge graph.
Downstream Tasks: Insights and Visualization
Downstream tasks focused on extracting insights from enriched data, generating actionable intelligence, and providing user-friendly visualization.


Impact and Future Potential—
IRGraph automates data enrichment, enabling IR teams to focus on strategic communication, boost investor confidence, and drive better outcomes. While tailored for Investor Relations, it also supports marketing and corporate strategy. Future directions include agent-based modeling, vector search, real-time sentiment tracking, nonverbal analysis, and text-to-chart visualization for greater flexibility and deeper insights.
Acknowledgments—
This project was a collaborative effort between the Bank of New York and Carnegie Mellon University. Special thanks to the dedicated team of faculty, students, and practitioners who made this possible, including:
Student team: Boyi Qian, Saloni Parekh, Pavitra Kadiyaka, Kedi Xu, Adrian Wang
CMU faculty: Dr. Michael Shamos, Dr. Eric Nyberg, Prof. Adam Paulisick, and Prof. Bryan Routledge.
BNY collaborators: Aditya Paul, Chris Ciurleo, Abhay Navale, and others.
Michael Hunger and the team at Neo4j for their invaluable expertise and tools.
Highlights —
This project was accepted into a ACM ICAIF’24 workshop called “The 1st Workshop on LLMs and Generative AI for Finance” , where Boyi Qian and I gave a poster presentation.


